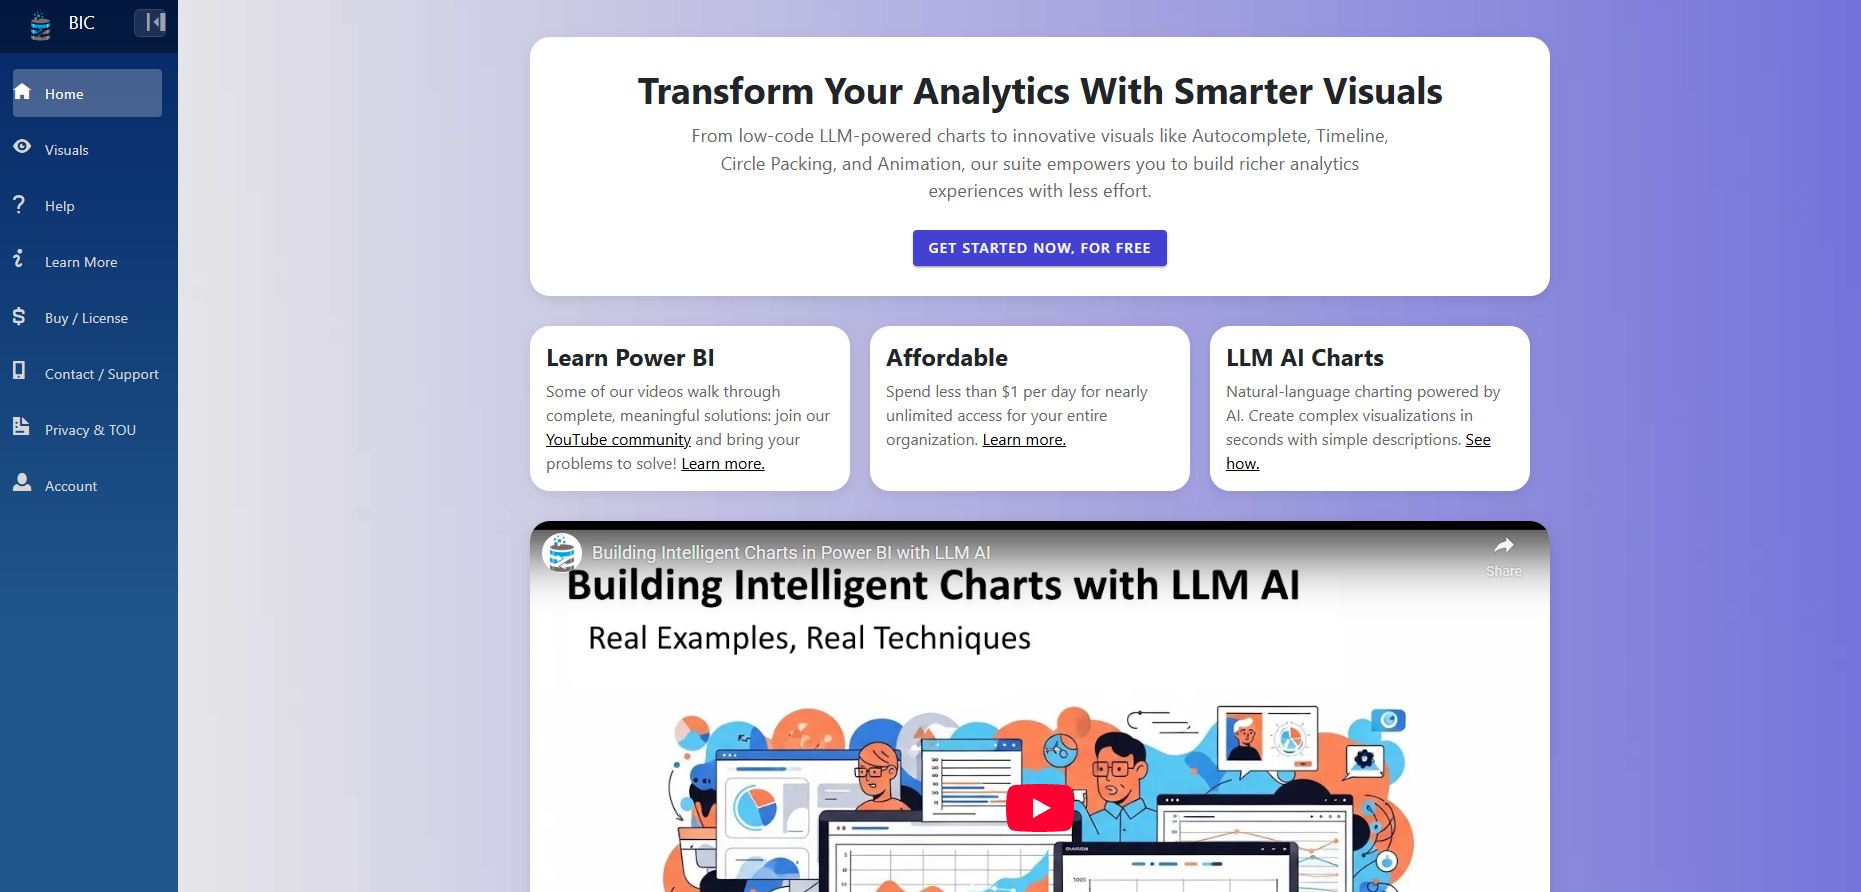
Transform Your Analytics With Smarter Visuals
📋 About
From low-code LLM-powered charts to innovative visuals like Autocomplete, Timeline, Circle Packing, and Animation, our suite empowers you to build richer analytics experiences with less effort.


Created by
mridul
📊 Product Details
- Status approved
- Launch Date Feb 2, 2026
- Upvotes 8
- Featured No
×
![Gallery Image]()
Login to post a comment
Login to write a review
No reviews yet. Be the first to review this product!